If you’ve ever run your WordPress website through a speed test and thought, Wait… what the heck happened?
You’re not alone.
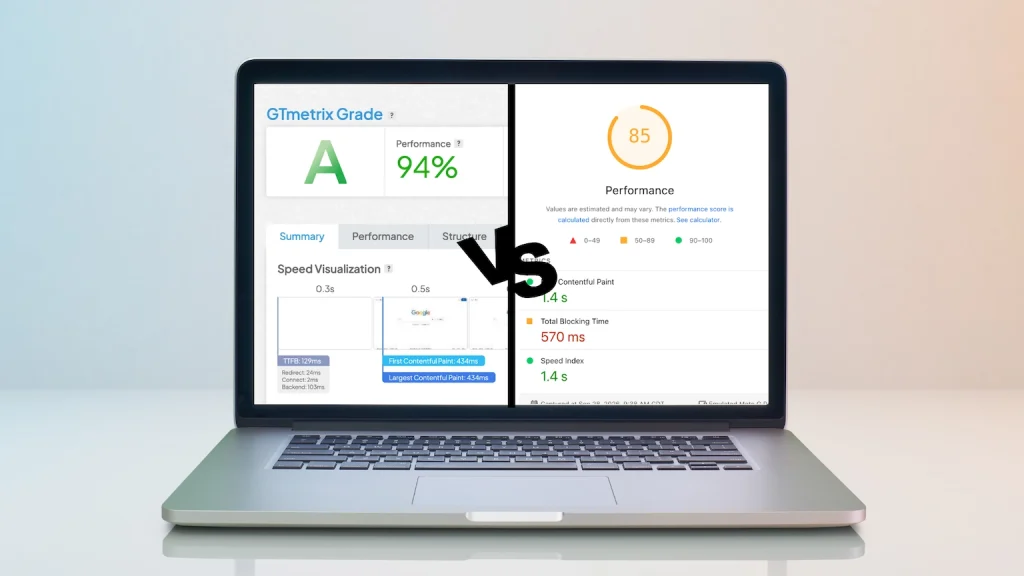
Maybe PageSpeed Insights gave you a 78. Then you ran the same site through GTmetrix and got a completely different score. Another free website speed test gave you a letter grade that made you feel like your website had just failed a pop quiz.
And then you ran the test again five minutes later… and got a different number.
Before you panic, take a breath.
Website speed and performance tools are useful. But they’re not perfect measurements of your website’s health.
Tools like Google PageSpeed Insights, GTmetrix, Pingdom and other website speed testers are designed to give you useful information about how a site performs under specific testing conditions. They’re excellent for identifying potential problems and tracking general improvements.
What they aren’t is a universal scoreboard where a 91 means your website is objectively “good” and an 89 means it suddenly isn’t.
In other words, don’t let a speed-test score drive you crazy.
Why Does the Same WordPress Website Get Different Speed Scores?
One of the most confusing things about website performance testing is that you can test the exact same website multiple times and get different results.
Same website.
Same day.
No changes made.
Different score.
That’s normal.
The reason is simple: different performance tools don’t test websites in exactly the same way.
Each tool has its own testing methodology, server locations, simulated devices, internet connection speeds and formulas for calculating its final score.
So when you see different numbers, you’re not necessarily looking at conflicting information. You’re often looking at the results of different tests.
Think of it like taking your car to several mechanics and asking them to evaluate its performance. One might focus on fuel efficiency. Another might look at acceleration. Another might be more concerned with engine noise.
They’re all looking at the same car, but they’re measuring different things.
Website speed tests work in much the same way.
Different Testing Locations Can Produce Different Results
Where a website is tested can make a difference.
Some performance tools allow you to choose a testing location, while others use particular locations or configurations by default.
For example, a website tested from Virginia may produce a different result than that same website tested from California. Testing from London could produce another result entirely.
That’s because the physical distance between the testing server and your website’s server can affect how quickly information travels back and forth.
If your WordPress website is hosted on a server in the United States and you’re testing it from a server in Europe, you’re introducing different network conditions than you would by testing it from somewhere closer to the website’s hosting location.
That doesn’t mean one test is “wrong.”
It means the tests are happening under different conditions.
Different Devices and Connection Speeds Matter, Too
Your website doesn’t perform in a vacuum.
Someone visiting your website on a newer desktop computer with a fast internet connection may have a different experience than someone visiting from an older smartphone on a slower mobile connection.
Performance tools can simulate different devices and connection conditions to see how your website responds.
Again, this is useful information.
But it means the resulting score is a snapshot of your website under that particular set of circumstances.
Change the circumstances, and the result can change.
Even the Same Speed Test Can Give You Different Results
Here’s another one that can make website owners question their sanity:
You can run your website through the same performance tool twice and get different results.
Why?
Because the internet isn’t perfectly consistent.
Your website’s server may be handling a little more traffic at one moment than another. Other websites on a shared hosting environment may temporarily be using more server resources. A cache may be cold during one test and warm during another.
A third-party script may respond more slowly during one scan.
Network conditions can change.
There are a lot of moving pieces involved in loading a modern website.
So if your site gets an 89 on one scan and an 83 on the next, that doesn’t necessarily mean your website suddenly became slower.
It may simply mean the conditions changed.
What About Load Time, Performance Scores and Other Metrics?

Speed-testing tools don’t just give you one big number.
You may see metrics related to:
- Load time
- First Contentful Paint
- Largest Contentful Paint
- Total Blocking Time
- Cumulative Layout Shift
- Performance score
- Accessibility
- Best practices
- SEO
These metrics can be extremely helpful because they give developers clues about what may be slowing down or otherwise affecting a website.
But it’s important to understand what you’re actually looking at.
A performance score isn’t the same thing as a stopwatch measuring exactly how long it takes every real person to load your website.
It’s an indicator based on a specific test environment and methodology.
That’s an important distinction.
Don’t Obsess Over Getting a 95 Instead of a 91
This is where website owners can get themselves into trouble.
You make some changes to your WordPress website and your score goes from 76 to 91.
Great!
Then you run another test and it drops to 87.
Suddenly you’re wondering what broke.
Probably nothing.
Or maybe you get a 94 and decide you absolutely have to reach 100.
Then you spend hours chasing tiny improvements that don’t meaningfully improve the experience for your actual customers.
The goal shouldn’t be a perfect performance score.
The goal should be a website that is fast, functional, stable and easy for real people to use.
If you’re improving meaningful performance issues, you’re moving in the right direction.
A general range and a trend over time can tell you much more than obsessing over whether your site scored 91, 93 or 95 on a particular scan.
So What Should You Actually Pay Attention To?
Instead of staring at the final score, look for patterns and actionable information.
For example, if several tests consistently point to large, unoptimized images, that’s worth investigating.
If a performance tool repeatedly identifies render-blocking scripts that are delaying important content, that’s something your WordPress developer can evaluate.
If your site’s server response time is consistently slow, your hosting environment may deserve a closer look.
Those are actionable findings.
A score changing by three or four points from one test to another?
Probably not something to lose sleep over.
Look for Trends
One of the best ways to use performance tools is to compare results before and after making changes.
For example:
Before optimization:
Your site consistently struggles with large image files.
After optimization:
Image-related warnings improve and important content loads more quickly.
That’s useful information.
You’re looking for a meaningful improvement, not a magic number.
Performance testing becomes much more valuable when you use it to answer questions such as:
Did this change help?
Did the problem we identified improve?
Is the website generally performing better over time?
Those questions are much more useful than:
Why did I get an 88 today when I got a 92 yesterday?!
Some Performance Problems Aren’t Even Your Fault
Modern WordPress websites often rely on third-party services.
You might have:
- A Google Map
- A booking system
- A chat widget
- A quote or contact tool
- A scheduling platform
- Analytics scripts
- Social media embeds
- Video embeds
- Marketing and tracking tools
These tools can be incredibly useful for your business.
They can also affect website performance.
And here’s the frustrating part: you may not have complete control over how quickly those third-party services respond.
You can optimize your own website beautifully and still see a performance warning caused by an external script or iframe.
That doesn’t automatically mean the tool should be removed.
Sometimes the functionality is worth the performance tradeoff.
The important thing is understanding what is actually causing the warning and whether fixing it would provide a meaningful benefit.
That’s where experience matters.
Caching Can Change Your Results
Caching can also affect website speed-test results.
A cached website can respond differently from a website that has just had its cache cleared.
That’s one reason testing immediately after clearing a cache may produce different results than testing the same website after visitors have loaded and cached certain resources.
Again, neither result is necessarily “wrong.”
They’re simply measuring the website under different conditions.
If you’re trying to compare performance before and after making a change, consistency matters.
Use the same tool.
Use the same testing location when possible.
Keep the testing conditions as similar as you can.
And look at the overall trend rather than one isolated score.
Your WordPress Hosting Matters
While performance tools shouldn’t be treated as absolute measurements, they can reveal patterns that are worth investigating.
Hosting is one of them.
A website running on an overloaded shared hosting environment may experience more variability than one running on infrastructure designed to provide better WordPress performance and resources.
If server response times are consistently poor or your results swing significantly under similar testing conditions, hosting may be part of the conversation. If you’re wondering whether your hosting environment is giving your WordPress website the resources it needs, learn more about Raney Day Design Website Hosting.
That doesn’t mean everyone needs expensive hosting.
It means your hosting environment is one piece of the performance puzzle.
Good WordPress performance isn’t just about compressing images or installing another optimization plugin. It involves looking at the website as a whole.
If you’re not sure whether your current hosting setup is helping or hurting your website, our Website Care Plan provides ongoing WordPress support, maintenance and monitoring to help keep your site running smoothly.
Use Speed Tests as a Tool, Not a Report Card
Website performance tools are incredibly useful when you know how to interpret them.
They can help identify:
- Oversized or unoptimized images
- Slow-loading scripts
- Render-blocking resources
- Caching issues
- Server response problems
- Layout shifts
- Other potential performance bottlenecks
But don’t confuse a testing tool’s score with the entire story of your website.
A 90 isn’t automatically a great website.
An 82 isn’t automatically a bad website.
And a score that changes from one test to the next doesn’t necessarily mean something broke.
Use performance tools as directional signals.
Look for recurring issues. Watch trends. Investigate actionable recommendations. Consider the real-world impact of proposed changes.
Most importantly, focus on whether your website provides a good experience for the people who actually use it.
Because at the end of the day, you’re not building a website for PageSpeed Insights.
You’re building it for your customers.
Worried About Your WordPress Website Speed?
If your website’s speed scores are starting to stress you out, we’re happy to take a look.
You don’t necessarily need to fix every warning or chase a perfect score.
We’ll help you figure out what’s actually worth fixing, what’s noise and where your time and money are better spent.
Because website performance should help you make better decisions about your website, not make you crazy.